Introduction
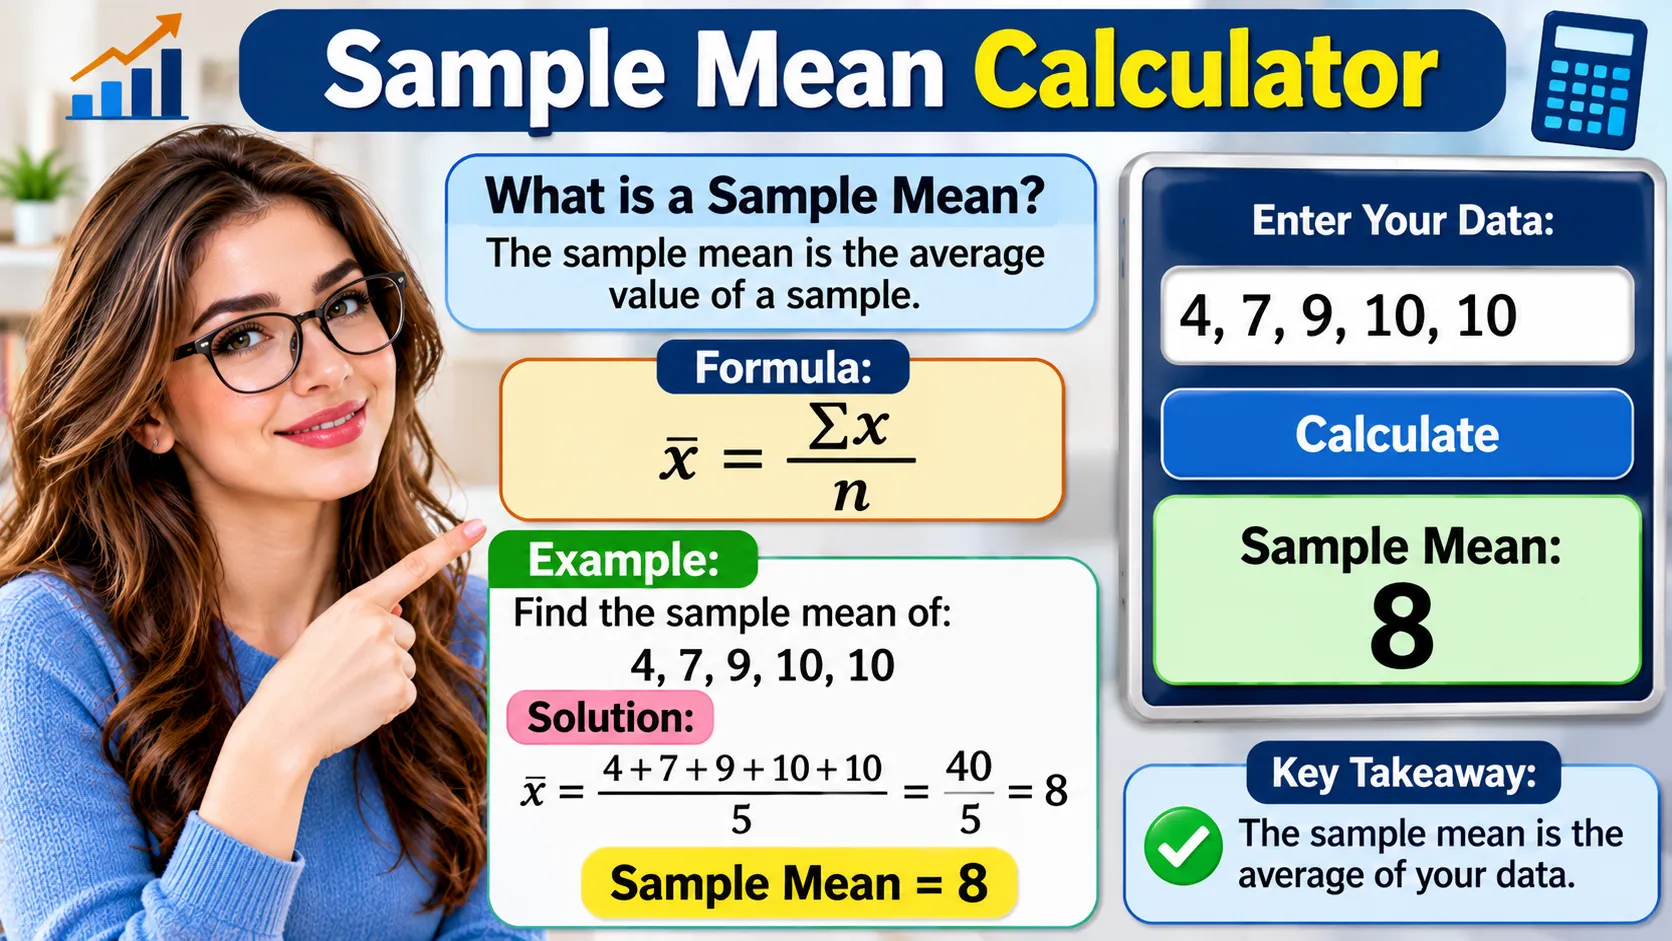
Need to calculate the average of a dataset? Our Sample Mean Calculator makes it easy to find the sample mean, total sum, and number of observations in seconds. Simply enter your numbers, choose your preferred decimal precision, and get your result with a clear calculation breakdown.
Whether you are completing statistics homework, analyzing research data, comparing examination scores, or studying statistical concepts, this calculator helps you understand your results without complicated calculations.
Below, you will learn what a sample mean is, which formula to use, how to calculate it manually, and how to interpret the answer correctly.
[Insert the Sample Mean Calculator HTML widget here.]
What Is a Sample Mean?
A sample mean is the arithmetic average of all numerical observations collected from a sample. It represents the central value of the selected data and is commonly used to estimate the average of a larger population.
In statistics, a population includes the entire group being studied, while a sample represents a smaller selection from that group.
For example, imagine a school has 500 students. Instead of collecting examination scores from every student, a researcher selects 30 students.
The average examination score of those 30 students is called the sample mean.
The sample mean is represented by the symbol x̄, pronounced “x-bar.”
Consider these five observations:
70, 75, 80, 85, 90
First, add all five numbers:
70 + 75 + 80 + 85 + 90 = 400
Next, divide the total by the number of observations:
400 ÷ 5 = 80
Therefore, the sample mean is 80.
In simple terms: A sample mean tells you the average value of the observations included in a selected sample.
Sample Mean Formula
The sample mean formula calculates the average by dividing the sum of all sample observations by the total number of observations.
The mathematical formula is:
[
\bar{x}=\frac{\sum_{i=1}^{n}x_i}{n}
]
Where:
- x̄ = Sample mean
- Σ = Summation symbol, meaning add all values
- xᵢ = An individual observation
- n = Total number of observations
- Σxᵢ = Sum of all sample values
For example, consider this dataset:
5, 10, 15, 20
Step 1: Calculate the sum.
5 + 10 + 15 + 20 = 50
Step 2: Count the observations.
n = 4
Step 3: Apply the formula.
[
\bar{x}=\frac{50}{4}=12.5
]
The sample mean is 12.5.
The sample mean and population mean use the same basic averaging process. However, the sample mean describes a selected sample, while the population mean describes the complete population.
How to Use the Sample Mean Calculator
Calculating averages manually is straightforward when you have a few numbers. However, larger datasets can make the process time-consuming.
Our calculator simplifies the calculation and displays the information needed to understand your result.
Follow these steps:
- Enter your numerical observations in the calculator’s input box.
- Separate the numbers using commas, spaces, semicolons, or new lines.
- Choose how many decimal places you want to display.
- Click the Calculate Sample Mean button.
- Review the calculated average.
- Check the total sum and sample size.
- Examine the step-by-step calculation.
- Use the copy option to save your result.
For example, enter:
10, 20, 30, 40, 50
The calculator produces:
| Calculation | Result |
| Sum | 150 |
| Sample size | 5 |
| Sample mean | 30 |
The calculation is:
150 ÷ 5 = 30
You can replace the example numbers with your own dataset whenever you need another result.
Tip: The calculator supports negative and decimal values, so you can use it for a variety of numerical datasets.
How to Calculate Sample Mean by Hand
You do not always need an online calculator to find an average. Once you understand the formula, you can calculate the sample mean using basic arithmetic.
Follow these three steps.
Step 1: Collect the observations
Suppose you have these measurements:
8, 12, 16, 20, 24
These five numbers represent your sample.
Step 2: Add all observations
8 + 12 + 16 + 20 + 24 = 80
The total sum is 80.
Step 3: Divide by the sample size
There are five observations, so n = 5.
Apply the formula:
[
\bar{x}=\frac{80}{5}=16
]
Final answer: The sample mean is 16.
Remember that every observation must be included. Leaving out a value or counting an observation twice can change your answer.
Sample Mean Calculation Examples
Different datasets can produce different averages. These examples demonstrate how the sample mean formula works with ordinary numbers, decimals, negative values, and repeated observations.
Example 1: Sample Mean of Five Numbers
Consider this dataset:
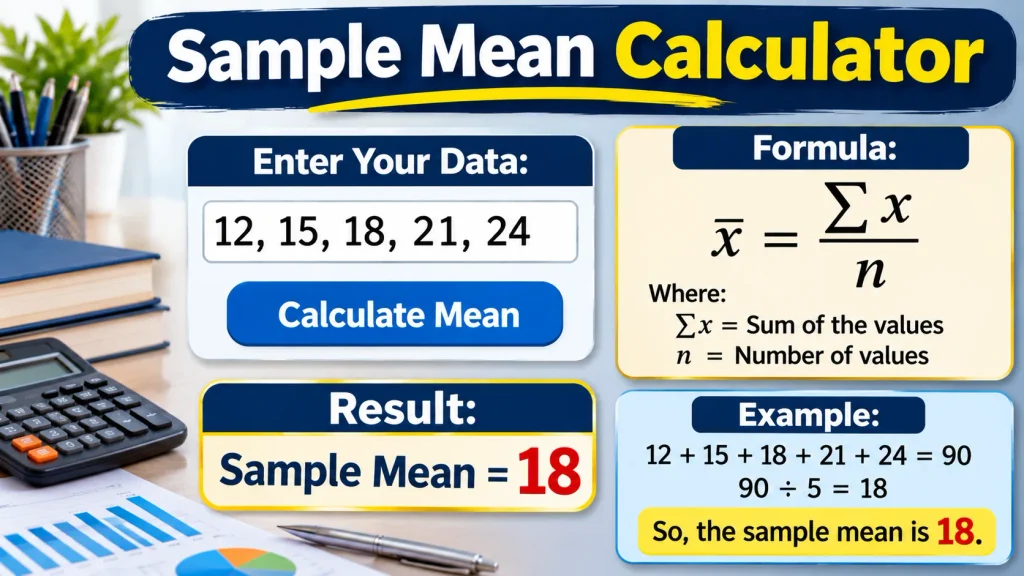
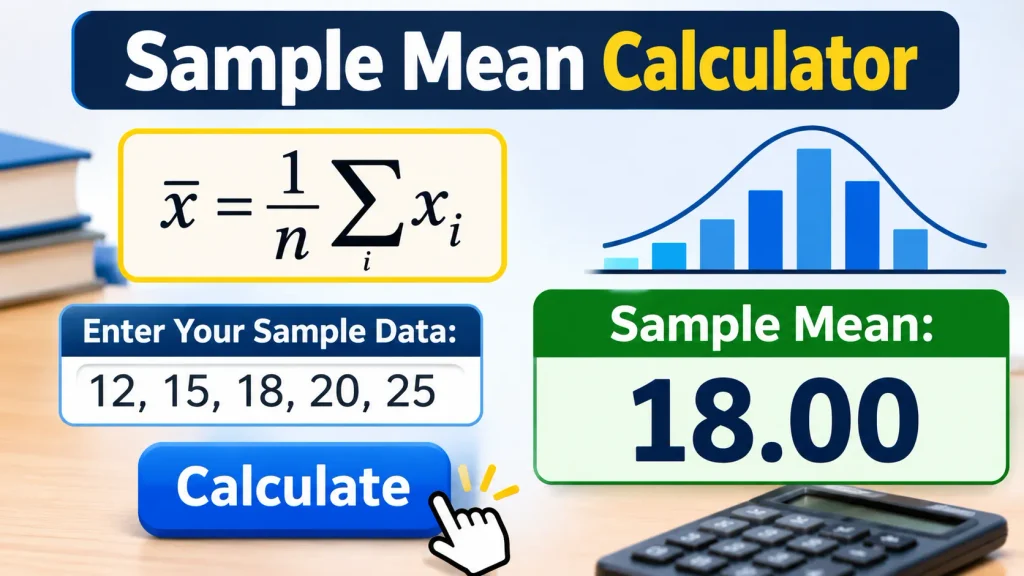
12, 15, 18, 20, 25
First, calculate the sum:
12 + 15 + 18 + 20 + 25 = 90
Number of observations:
n = 5
Apply the formula:
[
\bar{x}=\frac{90}{5}=18
]
Answer: 18
Example 2: Sample Mean with Decimal Numbers
Suppose a researcher records five measurements:
2.5, 3.5, 4.5, 5.5, 6.5
Calculate the total:
2.5 + 3.5 + 4.5 + 5.5 + 6.5 = 22.5
Count the observations:
n = 5
Divide the sum by the count:
[
\bar{x}=\frac{22.5}{5}=4.5
]
Answer: 4.5
Decimal observations are valid data values. Avoid rounding them before completing the calculation unless necessary.
Example 3: Sample Mean with Negative Numbers
Negative values can also be included in a sample mean calculation.
Consider:
-4, 2, 6
Calculate the sum:
-4 + 2 + 6 = 4
There are three observations.
[
\bar{x}=\frac{4}{3}=1.3333
]
Answer: Approximately 1.3333.
Always pay attention to negative signs because they affect the total.
Example 4: Sample Mean with Repeated Values
Consider the dataset:
5, 5, 10, 10, 10
Add all observations:
5 + 5 + 10 + 10 + 10 = 40
There are five observations.
[
\bar{x}=\frac{40}{5}=8
]
Answer: 8.
Repeated values must be counted according to how often they appear. Each occurrence contributes to both the sum and the sample size.
Example 5: Sample Mean of Examination Scores
Imagine a student receives these five examination scores:
65, 70, 75, 80, 90
The total is:
65 + 70 + 75 + 80 + 90 = 380
The sample size is five.
[
\bar{x}=\frac{380}{5}=76
]
Answer: The average examination score is 76.
This calculation provides a quick summary of the students’ performance across the five examinations.
Sample Mean vs. Population Mean
The sample mean and population mean both describe averages, but they represent different groups of observations.
A sample is a smaller selection from a larger population. A population includes every individual or observation in the group being studied.
Here is a comparison:
| Feature | Sample Mean | Population Mean |
| Symbol | x̄ | μ |
| Data used | Sample observations | All population observations |
| Sample size | n | N |
| Purpose | Estimate population average | Describe complete population |
| Formula | Σx/n | Σx/N |
Sample Mean Example
Suppose a university has 2,000 students, but a researcher selects 100 students to study their average study hours.
The average calculated from those 100 selected students is the sample mean.
Population Mean Example
If the researcher collects study-hour information from all 2,000 students, the calculated average is the population mean.
The distinction matters because a sample may not perfectly represent the entire population.
A properly selected random sample generally provides a more useful estimate than a sample chosen through a biased selection process.
Sample Mean vs. Median
The sample mean and median are both Measures Of Central Tendency. They summarize numerical datasets, but they use different calculation methods.
The sample mean is calculated by adding all observations and dividing their sum by the number of values.
The median is the middle value after arranging the observations from smallest to largest.
Consider this dataset:
10, 20, 30, 40, 100
Mean calculation:
[
\bar{x}=\frac{10+20+30+40+100}{5}
]
[
\bar{x}=\frac{200}{5}=40
]
Median calculation:
The middle observation is 30.
Therefore:
- Mean = 40
- Median = 30
The difference occurs because the unusually high value of 100 increases the mean.
| Feature | Mean | Median |
| Calculation | Sum divided by count | Middle ordered value |
| Uses every observation | Yes | Determined by middle position |
| Sensitive to extreme values | Yes | Generally less sensitive |
| Main purpose | Calculate an overall average | Identify the middle value |
The mean is useful when you want every observation to contribute to the average. The median can be more representative when your dataset contains extreme values or is strongly skewed.
Sample Mean with a Frequency Table
Sometimes statistical information is presented in a frequency table instead of a simple list of observations.
A frequency table shows how often each value appears. Instead of adding every repeated observation separately, you can multiply each value by its frequency.
The formula is:
[
\bar{x}=\frac{\sum fx}{\sum f}
]
Where:
- x = Individual data value
- f = Frequency of that value
- fx = Value multiplied by its frequency
- Σf = Total frequency
- Σfx = Sum of weighted values
Consider this example:
| Value (x) | Frequency (f) | fx |
| 2 | 3 | 6 |
| 4 | 2 | 8 |
| 6 | 1 | 6 |
| Total | 6 | 20 |
First, calculate the total frequency:
3 + 2 + 1 = 6
Next, calculate the total of fx:
6 + 8 + 6 = 20
Finally, apply the formula:
[
\bar{x}=\frac{20}{6}=3.3333
]
Answer: Approximately 3.3333.
This method is useful when working with survey results, examination scores, repeated observations, and frequency distributions.
How to Interpret the Sample Mean
Calculating an average is only the first part of statistical analysis. You should also understand what the result represents.
The sample mean summarizes the average value of the observations included in your sample.
For example, suppose a researcher records the daily study hours of six students:
2, 3, 4, 4, 5, 6
The sum is 24, and the sample size is six.
[
\bar{x}=\frac{24}{6}=4
]
The sample mean is four hours.
This means the six students studied an average of four hours per day.
However, it does not mean every student studied exactly four hours. Some studied less, while others studied more.
It also does not automatically mean every student in the entire school studies four hours per day.
The result describes the sample and can help estimate the population average when the sampling process is appropriate.
Why Is the Sample Mean Important in Statistics?
The sample mean is one of the most frequently used descriptive statistics because it provides a simple summary of Numerical Observations.
Researchers use it to understand datasets, compare groups, and estimate population characteristics.
Here are five important reasons it matters.
1. Summarizing large datasets
A dataset may contain hundreds or thousands of observations. The sample mean provides a single number that summarizes their average.
2. Comparing different groups
Researchers can compare the average scores, measurements, or results of two or more samples.
3. Estimating population characteristics
When collecting information from an entire population is impractical, researchers can use a properly selected sample to estimate its average.
4. Supporting statistical analysis
The sample mean is used in confidence intervals, hypothesis testing, and other statistical procedures.
5. Understanding research results
It helps researchers communicate the average measurement observed in an experiment or survey.
Although useful, the mean should be interpreted alongside information about variation, sample size, and the sampling method.
What Factors Affect the Sample Mean?
Several characteristics of a dataset can influence its calculated mean.
Understanding these factors helps you interpret statistical results correctly.
1. Individual Data Values
Every observation contributes to the total sum. Changing even one value can change the sample mean.
For example, changing 10, 20, and 30 to 10, 20, and 60 increases the average from 20 to 30.
2. Extreme Values
An unusually high or low observation can pull the mean away from the center of most values.
For example:
10, 12, 14, 16, 18
The mean is 14.
Now replace 18 with 100:
10, 12, 14, 16, 100
The mean becomes 30.4.
This demonstrates why extreme observations deserve attention.
3. Sample Size
The number of observations determines how many values contribute to the average.
A larger sample can provide a more precise estimate of a population mean when the sampling process is appropriate.
However, increasing the sample size does not automatically eliminate bias.
4. Sampling Method
The way observations are selected also matters.
A sample selected randomly and appropriately is generally more suitable for estimating a population average than one that systematically excludes certain groups.
5. Data Accuracy
Incorrect measurements, typing mistakes, and missing observations can produce misleading results.
Always check your dataset before performing calculations.
Sample Mean and Standard Error
The sample mean and Standard Error are related statistical concepts, but they do not represent the same thing.
The sample mean describes the average of the observed values.
The standard error describes the variability of sample means across repeated samples under a specified sampling model.
When the population standard deviation is known, the standard error of the sample mean is:
[
SE(\bar{x})=\frac{\sigma}{\sqrt{n}}
]
Where:
- SE = Standard error
- σ = Population standard deviation
- n = Sample size
When the population standard deviation is unknown, the sample standard deviation is commonly used to estimate the standard error:
[
SE(\bar{x})=\frac{s}{\sqrt{n}}
]
Where s represents the sample standard deviation.
Standard Error Example
Suppose:
- Sample standard deviation = 12
- Sample size = 36
The estimated standard error is:
[
SE=\frac{12}{\sqrt{36}}
]
[
SE=\frac{12}{6}=2
]
The standard error is 2.
A smaller standard error generally indicates greater precision in estimating the population mean, provided the assumptions behind the calculation are appropriate.
Remember: Standard deviation describes the spread of individual observations, whereas standard error describes the sampling variability of the estimated mean.
The standard error is not the same as the sample mean, and it cannot be calculated from the sample mean alone.
Related To Another Article: https://genzwishes.com/what-does-once-removed-mean/
Common Mistakes When Calculating Sample Mean
Although the sample mean formula is straightforward, common mistakes can lead to incorrect results.
Here are eight errors to avoid.
1. Dividing by the wrong number
Always divide the total sum by the number of observations, not by the largest value or the number of distinct values.
2. Ignoring negative values
Negative observations must be included with their correct signs.
3. Excluding repeated values
If a value appears multiple times, every occurrence must be counted.
4. Rounding too early
Keep sufficient precision during the calculation and round the final result according to your requirements.
5. Confusing sample mean with population mean
The sample mean describes the selected sample, while the population mean describes the entire population.
6. Treating the mean as the most common value
The mean is not necessarily the most frequently occurring observation. The mode identifies the most frequent value.
7. Ignoring extreme observations
Outliers can have a substantial influence on the mean. Review unusual values before interpreting the result.
8. Assuming a larger sample always removes bias
A large sample can still produce misleading estimates if its selection method is biased.
Avoiding these mistakes makes statistical calculations more reliable and easier to explain.
Real-World Applications of Sample Mean
The sample mean is useful in many fields because researchers and Professionals Regularly need to summarize numerical information.
Here are five practical applications.
Education
Teachers and researchers calculate average examination scores to understand student performance.
For example, a teacher may select 20 students and calculate their average mathematics score to evaluate a particular class.
Healthcare Research
Researchers use sample averages to summarize measurements collected from selected study participants.
Examples include average body measurements, laboratory results, and treatment-related measurements.
The mean alone does not establish whether a treatment is effective. Additional statistical analysis and appropriate research methods are required.
Business and Finance
Businesses use average sales, transaction values, and customer spending to understand performance.
For example, a company may calculate the average daily sales of a selected group of stores.
Scientific Experiments
Scientists calculate sample means to summarize measurements collected during experiments.
They may compare average temperatures, reaction times, growth measurements, or experimental outcomes.
Market Research
Researchers analyze survey responses to estimate average customer spending, satisfaction scores, or other numerical characteristics.
The quality of these estimates depends on how the sample was selected and measured.
Limitations of the Sample Mean
The sample mean is useful, but it does not provide a complete picture of a dataset.
Understanding its limitations prevents incorrect conclusions.
Sensitive to outliers: Extremely high or low values can change the average considerably.
Does not describe variation: Two datasets can have the same mean but very different distributions.
Depends on sample quality: A biased sample may produce an inaccurate estimate of the population mean.
Can hide differences between groups: An overall average may conceal important differences among subgroups.
Not suitable for every data type: The arithmetic mean is designed for numerical data. It is generally not meaningful for purely categorical labels.
For better statistical interpretation, consider using the sample mean alongside the median, standard deviation, range, and other relevant descriptive statistics.
People Also Ask
A: The sample mean formula is x̄ = Σx/n. Add all the observations in the sample and divide their sum by the total number of observations. The result represents the average value of the selected sample.
A: First, add all the sample values together. Second, count the total number of observations. Third, divide the sum by the count. For example, 10, 20, and 30 have a sum of 60 and a sample mean of 20.
A: Yes. The sample mean is the arithmetic average of the observations in a sample. The word sample indicates that the average was calculated from a selected group rather than the entire population.
A: A sample mean represents the average of a selected subset of observations, while a population mean represents the average of every observation in the complete population. Their formulas are similar, but their symbols and interpretations differ.
A: Yes. A sample mean can be a decimal, a whole number, or a negative number. Its value depends on the observations included in the dataset and their combined sum.
Conclusion
The sample mean is an Essential Statistical measure that helps summarize numerical observations and estimate population averages.
Its calculation is simple: add all sample values and divide the total by the number of observations. However, understanding the result requires more than knowing the formula. You should also consider sample size, data quality, extreme values, and the method used to select observations.
Use the Sample Mean Calculator at the beginning of this guide to calculate your dataset quickly, verify the total and observation count, and understand how the final average is obtained.
Whether you are a student, researcher, teacher, or professional, learning how to calculate and interpret the sample mean can make statistical analysis easier and more meaningful.











1 thought on “Sample Mean Calculator – Calculate Sample Average”