Introduction
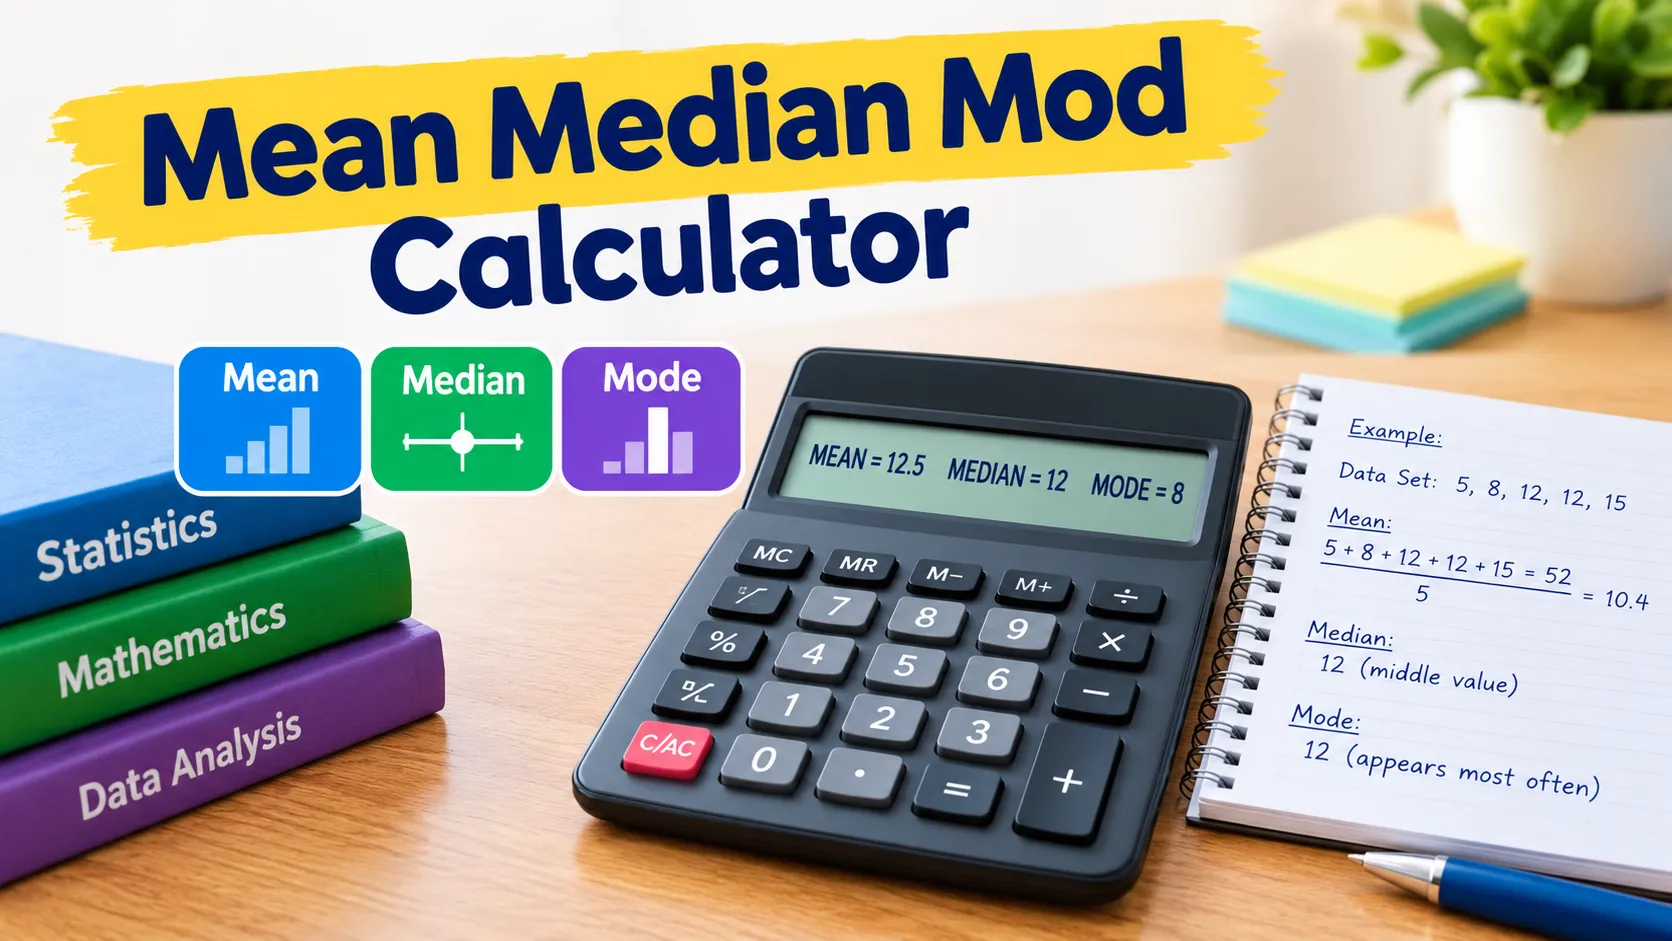
A mean, median, and Mode Calculator helps you find the average, middle value, and most frequently occurring value in a dataset. Instead of calculating everything manually, you can use a calculator to obtain results quickly and check how each answer was determined.
Whether you are studying mathematics, checking homework, or analyzing numerical information, understanding these three statistical measures makes calculations easier. This guide explains the formulas, demonstrates practical examples, and highlights common mistakes so you can interpret your results confidently.
1. What Is a Mean Median Mode Calculator?
A mean, median, and mode calculator is a mathematical tool that calculates three measures of central tendency from a list of numbers. Each measure describes a different feature of the dataset.
Understanding what each result represents helps you choose the right statistical measure.
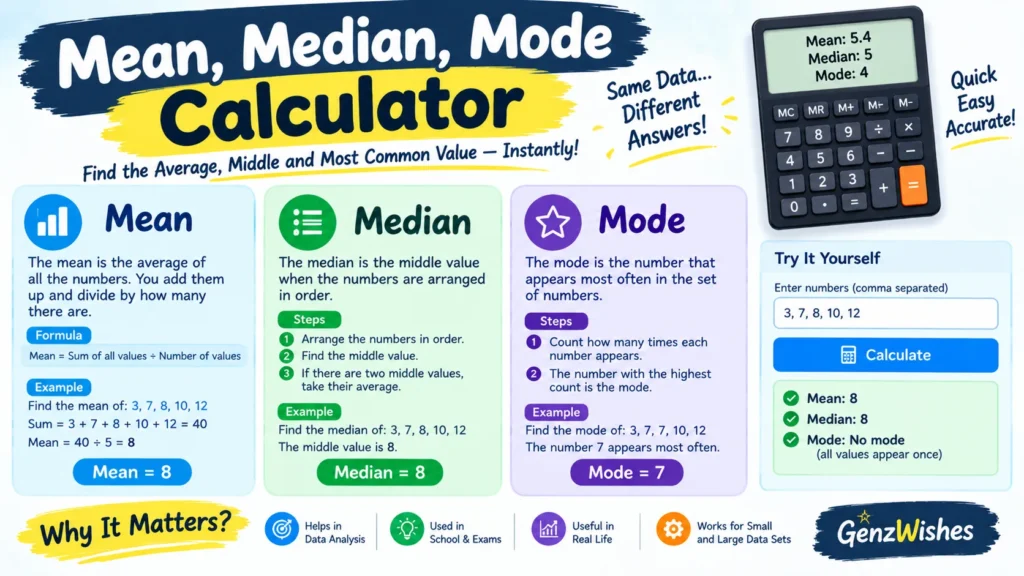
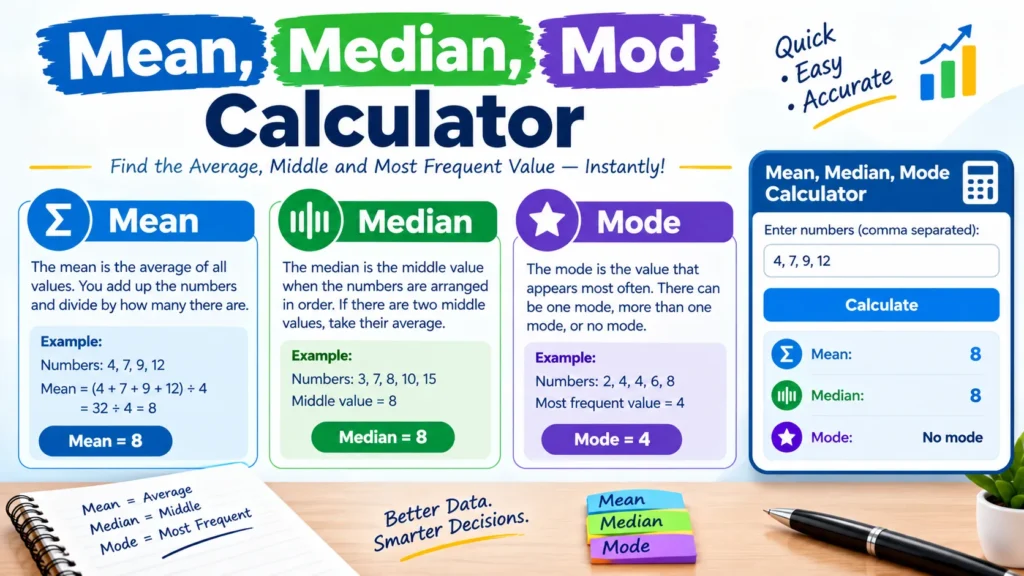
- Mean: The arithmetic average of all values.
- Median: The middle value after sorting the numbers.
- Mode: The value that occurs most frequently.
- Sum: The total obtained by adding all observations.
- Count: The total number of observations, including repeated values.
- Minimum: The smallest number in the dataset.
- Maximum: The largest number in the dataset.
- Range: The maximum minus the minimum.
- Sorted data: The numbers arranged from smallest to largest.
- Frequency: The number of times a value appears.
- Outlier: A value unusually far from other observations.
- Dataset: The complete collection of numbers being analyzed.
- Central tendency: A way to describe the center of a dataset.
- Calculation steps: The mathematical process used to obtain a result.
- Result verification: Checking whether the calculated answers are correct.
A reliable calculator should explain its results instead of displaying unexplained numbers.
2. How to Use an Online Mean Median Mode Calculator
Using an online calculator is simple when you understand the input format and available controls. Most basic calculators accept a list of numerical observations.
Follow these practical steps to obtain accurate results.
- Open the calculator on your website.
- Locate the numerical input field.
- Enter the numbers you want to analyze.
- Separate the values with commas if the calculator supports comma-separated input.
- Use spaces or line breaks if the tool accepts those formats.
- Include repeated values when they appear in the original dataset.
- Enter negative numbers correctly.
- Include decimal values when necessary.
- Check the list for accidental omissions.
- Remove unsupported characters.
- Select the Calculate button.
- Read the mean displayed in the results.
- Check the median against the sorted dataset.
- Review the mode and its frequency.
- Copy or save the results if you need them for homework or a report.
Example: Enter 4, 6, 6, 8, 11.
The mean is 7, the median is 6, and the mode is 6.
These results assume the calculator processes every number as a separate observation.
3. What Is the Mean in Mathematics?
The mean is the arithmetic average of a group of numbers. You calculate it by adding every observation and dividing the total by the number of observations.
The mean uses every value, which makes it useful for summarizing numerical data.
- Add all the observations together.
- Count the total number of observations.
- Divide the sum by the count.
- Include repeated values in the sum.
- Count repeated values separately.
- Use negative numbers with their correct signs.
- Include decimal values when present.
- Avoid dividing by the number of distinct values.
- Check the sum before dividing.
- Keep sufficient decimal precision during calculations.
- Round the final result only when appropriate.
- Remember that the mean may not appear in the original dataset.
- Recognize that extreme values can influence the mean.
- Compare the mean with the median when outliers exist.
- Use the mean when an arithmetic average answers your question.
Example: Find the mean of 5, 7, 9, and 11.
Sum = 5 + 7 + 9 + 11 = 32.
Count = 4.
Mean = 32 ÷ 4 = 8.
4. What Is the Median?
The median identifies the middle of an ordered dataset. Unlike the mean, it depends on the positions of the observations rather than their total.
You must arrange the values from smallest to largest before finding the median.
- Write down every observation.
- Arrange the numbers in ascending order.
- Count the total observations.
- Determine whether the count is odd or even.
- Identify the central position when the count is odd.
- Select the value at that position.
- Find the two central positions when the count is even.
- Add the two middle values.
- Divide their sum by two.
- Do not select the middle value before sorting.
- Include duplicate values in their correct positions.
- Include negative numbers in ascending order.
- Treat decimal values like other numerical observations.
- Remember that the median may not be an observed value.
- Use the median when the middle observation matters more than the arithmetic average.
Example: Find the median of 3, 5, 7, 9, and 11.
The middle value is 7, so the median equals 7.
For 2, 4, 8, and 10, the middle values are 4 and 8.
Median = (4 + 8) ÷ 2 = 6.
5. What Is the Mode?
The mode is the value that appears most frequently in a dataset. It helps identify common observations and can also be used with categorical data.
Unlike the mean, the mode does not require adding or averaging the observations.
- List all the values.
- Identify the distinct numbers.
- Count how often each number appears.
- Find the highest frequency.
- Identify the value with that frequency.
- Report every tied mode when appropriate.
- Recognize that a dataset may have two modes.
- Recognize that a dataset may have more than two modes.
- Understand that some datasets have no mode.
- Avoid assuming the largest value is the mode.
- Avoid assuming the smallest value is the mode.
- Include repeated observations when counting frequencies.
- Use the mode to identify common numerical values.
- Use the mode to identify common categories.
- Check the calculator’s convention for datasets without repeated values.
Example: Consider 2, 3, 3, 5, and 7.
The number 3 appears twice, while every other value appears once.
Therefore, the mode is 3.
6. Mean, Median, and Mode Formulas
The three measures use different Mathematical Procedures. Knowing their formulas helps you verify a calculator’s results.
These formulas apply to ordinary numerical datasets, with the median requiring the observations to be sorted.
- Mean formula: Mean = Sum of values ÷ Number of values.
- Mean notation: x̄ = x̄n.
- Median preparation: Arrange the data in ascending order.
- Odd-sized median position: (n+1)/2.
- Even-sized median positions: n/2 and n/2+1.
- Even-sized median formula: Average the two middle values.
- Mode method: Identify the value with the highest frequency.
- Sum notation: x represents the total of the observations.
- Count notation: n represents the number of observations.
- Frequency notation: f represents the number of occurrences.
- Frequency-table mean: Divide the sum of value-frequency products by total frequency.
- Mean sensitivity: Extreme values can substantially affect the result.
- Median sensitivity: The median is generally less affected by extreme magnitudes.
- Mode interpretation: Frequency determines which values qualify as modes.
- Rounding rule: Preserve calculation precision until the final result.
For a frequency table, the mean formula becomes:
Mean=fxf
Here, x represents each distinct value and f represents its frequency.
7. Step-by-Step Mean, Median, and Mode Examples
Worked examples help you understand how all three measures apply to the same dataset. They also provide a simple way to verify the results returned by an online calculator.
Consider the numbers 2, 4, 4, 6, and 9.
- Write the complete dataset.
- Confirm that it contains five observations.
- Add the values: 2 + 4 + 4 + 6 + 9 = 25.
- Divide 25 by 5 to calculate the mean.
- Record the mean as 5.
- Arrange the numbers in ascending order.
- Confirm that the ordered dataset is 2, 4, 4, 6, 9.
- Calculate the median position: (5 + 1) ÷ 2 = 3.
- Identify the third value.
- Record the median as 4.
- Count the frequency of each distinct number.
- Confirm that 4 appears twice.
- Check that the other values appear once.
- Record 4 as the mode.
- Compare the three results for consistency.
The final results are:
| Measure | Result |
| Mean | 5 |
| Median | 4 |
| Mode | 4 |
| Sum | 25 |
| Count | 5 |
| Range | 7 |
This example shows why the three measures should not be treated as interchangeable.
8. Mean, Median, and Mode for Odd and Even Datasets
The number of observations determines how you locate the median. Odd-sized datasets have one central observation, while even-sized datasets have two central observations.
Understanding this distinction prevents one of the most common calculation errors.
- Count every observation.
- Sort the dataset.
- Check whether the count is odd.
- Check whether the count is even.
- For five values, select the third value.
- For seven values, select the fourth value.
- For nine values, select the fifth value.
- For four values, identify the second and third values.
- For six values, identify the third and fourth values.
- For eight values, identify the fourth and fifth values.
- Add the two middle values in an even-sized dataset.
- Divide their sum by two.
- Do not discard duplicate values.
- Keep negative and decimal observations in sorted order.
- Verify the final median against the original dataset.
Odd example: 1, 3, 5, 7, 9.
Median = 5.
Even example: 1, 3, 5, 7.
Median = (3 + 5) ÷ 2 = 4.
Notice that 4 does not appear in the original dataset, yet it is the correct median.
9. Datasets With Multiple Modes or No Mode
The mode depends on frequency rather than Numerical size. A dataset can have one mode, several modes, or no mode under the convention that a mode must occur more frequently than the other values.
These examples clarify the differences.
- One mode: 1, 2, 2, 3, 4. The mode is 2.
- Two modes: 1, 1, 2, 2, 3. The modes are 1 and 2.
- Three modes: 1, 1, 2, 2, 3, 3, 4. The modes are 1, 2, and 3.
- No repeated values: 2, 4, 6, 8. There is no mode under the convention used here.
- Repeated negative values: -3, -3, -1, 0. The mode is -3.
- Repeated decimals: 1.5, 1.5, 2.5, 3.5. The mode is 1.5.
- Repeated large values: 100, 100, 200, 300. The mode is 100.
- Two frequent categories: Red, blue, red, blue, green. Red and blue are modes.
- Equal frequencies: 2, 2, 4, 4. Both 2 and 4 are modes.
- Three tied values: 5, 5, 6, 6, 7, 7. All three are modes.
- A single observation: 8. Under the stated convention, 8 is the only mode.
- A dominant value: 1, 1, 1, 2, 3. The mode is 1.
- An extreme value: 1, 2, 2, 3, 100. The mode is 2.
- Repeated middle value: 1, 3, 3, 5, 7. The mode and median are both 3.
- No unique most frequent value: If every value occurs equally often, there may be no unique mode; conventions vary.
When interpreting the result, check the calculator’s definition of mode, particularly when every observation appears once.
10. Mean vs. Median vs. Mode
The mean, median, and mode all summarize a dataset, but they answer different questions. Choosing the appropriate measure depends on what you want to understand.
Use this comparison to decide which measure best fits your task.
- The mean answers: What is the arithmetic average?
- The median answers: What is the middle value?
- The mode answers: Which value occurs most frequently?
- The mean uses every observation in its calculation.
- The median depends on ordered positions.
- The mode depends on frequency.
- The mean does not require sorting.
- The median requires sorting or an equivalent selection method.
- The mode requires frequency comparisons.
- Extreme values can strongly affect the mean.
- Extreme magnitudes generally have less influence on the median.
- The mode can describe numerical values or categories.
- The mean is useful for many numerical summaries.
- The median is often useful for skewed distributions.
- The mode helps identify the most common observation.
| Feature | Mean | Median | Mode |
| Main purpose | Arithmetic average | Middle value | Most frequent value |
| Uses addition? | Yes | Only when averaging two middle values | No |
| Requires sorted data? | No | Yes | No |
| Multiple results possible? | One | One | Yes |
| Works with categories? | Usually no | Usually no | Yes |
11. When Should You Use Each Statistical Measure?
The most useful measure depends on the question you want to answer. In many situations, examining all three gives a more complete picture of the data.
Consider these practical applications.
- Exam marks: Use the mean to summarize average performance.
- Middle exam score: Use the median to identify the central result.
- Most common mark: Use the mode to identify a frequently occurring score.
- Household expenses: Compare mean and median spending.
- House prices: Consider the median when a few expensive properties distort the mean.
- Product sizes: Use the mode to identify the most frequently purchased size.
- Customer spending: Use the mean for arithmetic average spending.
- Delivery times: Compare mean and median when some deliveries experience extreme delays.
- Survey categories: Use the mode to identify the most common response.
- Research datasets: Select a measure that fits the distribution and research question.
- Sports scores: Calculate the mean to summarize scoring performance.
- Production measurements: Compare the mean and median to identify possible skew.
- Attendance records: Use the mode to find the most common attendance count.
- Small numerical samples: Calculate all three to understand different aspects of the observations.
- Data reporting: Explain why you selected a particular measure.
Remember that the best measure depends on the data, its distribution, and the purpose of the analysis.
Related To Another Article: https://genzwishes.com/what-does-hy-mean-in-text/
12. Common Mean M, Median, Mode Calculation Mistakes
Small mistakes can produce incorrect results even when the formulas are simple. Checking the input and calculation steps can help prevent these errors.
Review these common problems before accepting your calculator’s output.
- Forgetting to include a value.
- Counting distinct values instead of all observations.
- Adding numbers incorrectly.
- Dividing the sum by the wrong count.
- Finding the median before sorting the data.
- Selecting only one middle value in an even-sized dataset.
- Forgetting to average the two middle values.
- Assuming every dataset has exactly one mode.
- Assuming a dataset without repeated values must have a unique mode.
- Ignoring negative signs.
- Entering decimal separators incorrectly.
- Accidentally including a number twice.
- Removing repeated values that belong in the dataset.
- Rounding intermediate calculations too early.
- Confusing the mean with the median.
Quick verification tip: Test your calculator using a small dataset whose answer you can determine manually. If the results disagree, inspect the input format and calculation steps.
13,. Mean, Median, Mode With Frequency Tables
A Frequency table summarizes data by listing each distinct value and how many times it occurs. This format is useful when a dataset contains many repeated observations.
For frequency tables, calculate the total frequency before finding the three measures.
- List each distinct value.
- Record its frequency.
- Multiply each value by its frequency.
- Add the resulting products.
- Add all frequencies to find the observation count.
- Divide the weighted sum by the total frequency to calculate the mean.
- Expand the values conceptually or use cumulative frequencies to locate the median.
- Identify the middle observation or observations.
- Average the two middle values when the total frequency is even.
- Find the value with the highest frequency.
- Report tied modes when appropriate.
- Check that all frequencies are nonnegative counts.
- Confirm that the total frequency is greater than zero.
- Verify the results with a small expanded dataset.
- Keep the frequency-table input format separate from ordinary number-list input.
Example:
| Value | Frequency |
| 2 | 2 |
| 4 | 3 |
| 6 | 1 |
The total frequency is 6.
The weighted sum is:
(22)+(43)+(61)=22
Mean = 22 ÷ 6 ≈ 3.67.
The expanded dataset is 2, 2, 4, 4, 4, 6.
Median = 4.
Mode = 4.
People Also Ask
A: Use an online calculator for quick results, or calculate the mean from the sum and count, find the median after sorting, and identify the most frequent value for the mode.
A: Sort the numbers and average the fifth and sixth values.
A: The median depends on the positions of observations rather than the magnitude of every value. An extreme value can change the mean considerably without changing the median.
A: Yes. You can use the formulas and count frequencies manually. A calculator simply makes the process faster.
A: Check the input, repeated values, negative signs, sorting, and rounding. Then verify the result using a small manual calculation.
Conclusion
A mean, andan median, and mode calculator makes it easier to Summarize data, check homework, and understand basic statistics. The mean gives the arithmetic average, the median identifies the center of an ordered dataset, and the mode reveals the most frequent value.
- Use the mean to calculate an arithmetic average.
- Use the median to identify the center of ordered data.
- Use the mode to find the most frequent value.
- Include every observation in the dataset.
- Sort the data before finding the median.
- Average the two middle values for an even-sized dataset.
- Check frequencies when identifying modes.
- Understand that multiple modes are possible.
- Recognize that some datasets have no mode.
- Compare the mean and median when extreme values exist.
- Use frequency tables carefully.
- Verify results with worked examples.
- Avoid rounding intermediate calculations unnecessarily.
- Choose the measure that best answers your question.
- Bookmark the guide and share it with someone learning statistics.
The best way to learn these concepts is to combine calculator results with an understanding of the underlying mathematics. With practice, you can calculate and interpret all three measures confidently.